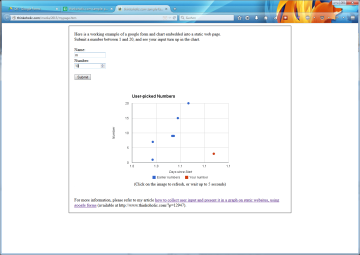
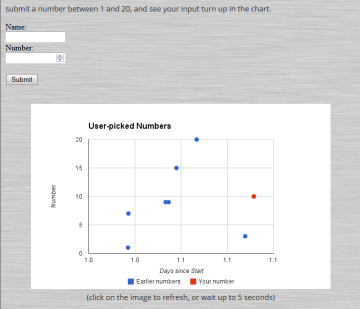
 the problem: for a small web project that is going to run on a server with very restricted functionality (due to safety concerns), we wanted to include a web form where visitors can submit values. these values should then be presented in a graph, showing all submitted values and highlighting the latest addition.
the solution: after some digging, i found a way to do all of that using google forms/spreadsheets, which offers user input, a simple spreadsheet-based database, as well as dynamic image creation.
check out the working example page and the underlying spreadsheet, and continue reading for a step-by-step tutorial on how to create a web form that plugs into an automatically refreshing graph/chart using very basic means, and how to implement it all using just two static web pages, a google form, and a google spreadsheet.
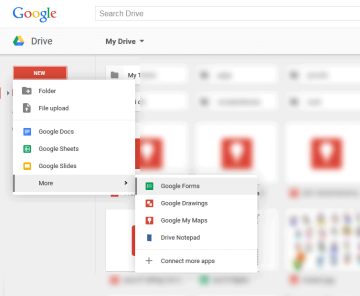
- go to drive.google.com, hit the “NEW” button and select “more”, “google forms”.
- enter a form title and create your form fields (“questions”). in our case, these will be for the user’s name (“Name”) and a number to pick between 0 and 20 (“Number”). since we want to collect data to use in our graph, we’ll make the number a required question and validate it for numeric data, via “advanced settings”.
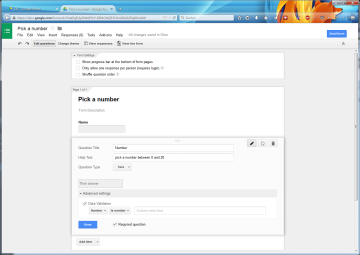
- under “confirmation page”, we’ll include a short sentence à la “your input has been saved”, and uncheck the three checkboxes below.
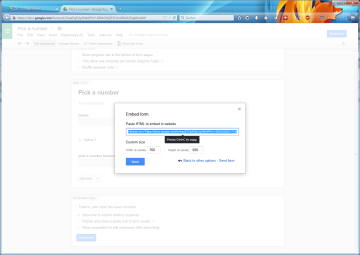
- click on “send form”, and copy both the link to share and the embed code for later reference.
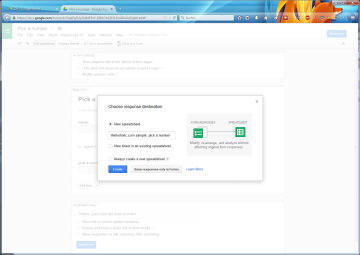
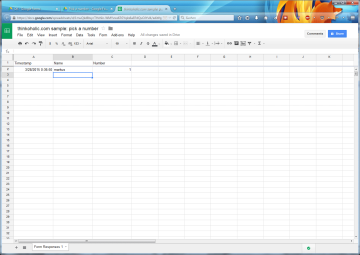
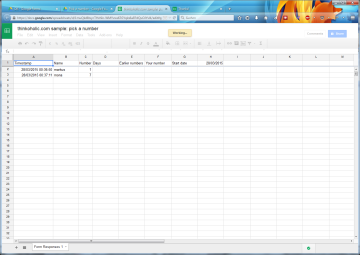
- now, let’s set the destination for submitted data, by clicking on “view responses” in the top of the page. select “new spreadsheet”, enter a file name, and uncheck “always create a new spreadsheet”. click “create”, and a new tab opens with your spreadsheet with three columns, “timestamp” (time the row was submitted), and our two created fields “name” and “number”.
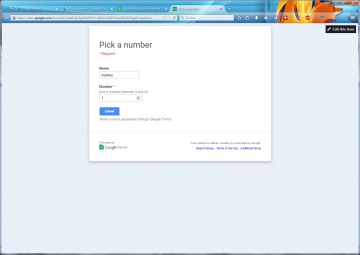
- in a new tab, enter your form URL and submit two sets of example data. this will result in two new rows in your spreadsheet.
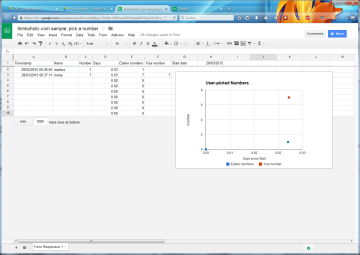
- since we’ll create a graph of user-picked numbers over time based on web input, let’s create two more columns that will allow us to do a basic data check before allowing individual rows into the graph. the first one can be called anything, the second should be your desired label for data points in the graph. in our case, i’ll call them “days” (field D1) and “earlier numbers” (E1).
- next to that, and still in the first row, enter the desired label for your latest data point, which will show the latest user their just-submitted point, e.g. “your number” (F1). in the first row of columns G and H, enter “start date” and yesterday’s date, respectively.
- in order to compute the “days since start”, just enter (or copy and paste) this formula into field D2:
=ArrayFormula( if(A2:A>$H$1,(A2:A-$H$1),0))
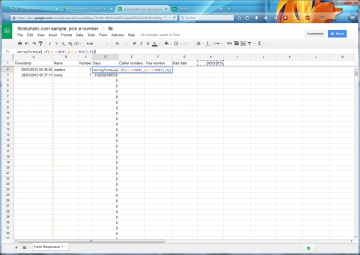
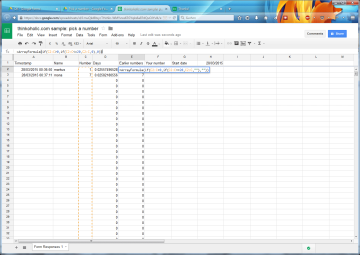
- in column E, we can for example automatically exclude values that are below 0 or above 20, using this formula in field E2:
=ArrayFormula(if(C2:C>0,if(C2:C<=20,C2:C,""),""))
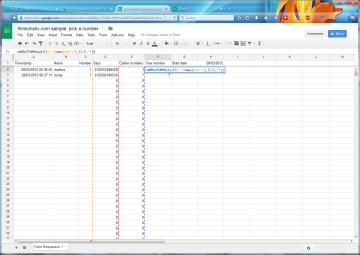
- column F should just show us the latest measurement value and omit everything else, so we'll use the following formula in field F2:
=ARRAYFORMULA(if(D2:D=max($D$2:D),E2:E,""))
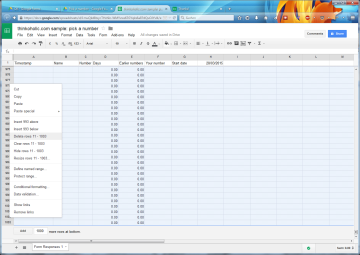
- now select columns D, E and F and make them number columns ("format", first option, "number"; you may modify post-comma digits etc.), and select all rows below 10, right-click, and choose "delete rows".
- choose "insert", "chart". modify the data range to use only columns D and E (all values, one point colour), and separately column F (latest value, other point colour):
'Form Responses 1'!D1:E10, 'Form Responses 1'!F1:F10
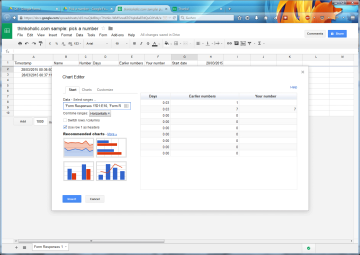
- be sure to check "use row 1 as headers".
- under charts, choose "scatter" and "scatter chart", and press "insert".
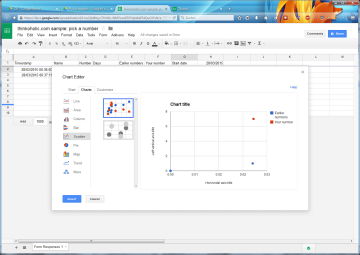
- modify the chart title and axis labels, and optionally move the legend by clicking on it and selecting the desired position from the drop-down menu.
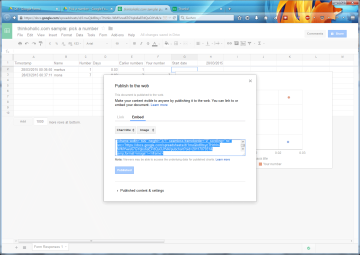
- finally, click on the drop-down arrow in the top right of the chart and select "publish chart".
here, you can choose "embed" and decide whether it should be an interactive embed, or just a static picture. to display your chart just as a static png image (which will change when there's new input), change the second option to "image", and confirm with "publish". copy the embed code, remove everything but the URL, and create an <img ...> tag like this:original:
<iframe width="600" height="371" seamless frameborder="0" scrolling="no" src="https://docs.google.com/spreadsheets/d/1muQkd8tsycTHzhIn-WMYvws67GYqks6aEPdQuOJYvl4/pubchart?oid=2011707931&format=image"></iframe>new:
<img src="https://docs.google.com/spreadsheets/d/1muQkd8tsycTHzhIn-WMYvws67GYqks6aEPdQuOJYvl4/embed/oimg?id=1muQkd8tsycTHzhIn-WMYvws67GYqks6aEPdQuOJYvl4&oid=2011707931"> - place this code in your static html webpage, and the image will show the current data of your spreadsheet when the page loads:
- go back to the form url, open the page source, and copy everything between <form ...> and </form>.
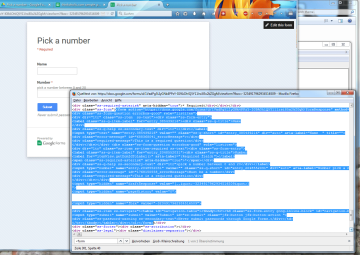
- copy the below code into a text editor and update the bold strings with details from your source code:
<html>

<head>

	<title>Modified form</title>

</head>

<body>

<div style="height:140px; width=235px; overflow:hidden">

	<form onsubmit="" target="_self" id="ss-form" method="POST" action="https://docs.google.com/forms/d/1muQkd8tsycTHzhIn-WMYvws67GYqks6aEPdQuOJYvl4/formResponse">

	<label for="entry_1376693871" class="ss-q-item-label">Name:</label><br />

	<input type="text" title="" aria-label="Name" dir="auto" id="entry_385439216" class="ss-q-short valid" value="" name="entry.385439216" style="width:120px !important;">

	<br />

	<label for="entry_2048552031" class="ss-q-item-label">Number:

	<label aria-label="(Required field)" for="itemView.getDomIdToLabel()"></label></label> <br />

	<input type="number" title="Input invalid" step="any" required="" aria-required="true" aria-label="Input invalid" dir="auto" id="entry_2048552031" class="ss-q-short valid" value="" name="entry.2048552031" style="width:120px !important;">

	<input type="hidden" value="[,,"-3234917962934516509"]" name="draftResponse">

	<input type="hidden" value="0" name="pageHistory">

	<input type="hidden" value="-3234917962934516509" name="fbzx">

	<br /><br />

	<input type="submit" class="jfk-button jfk-button-action " id="ss-submit" value="Submit" name="submit">

</div>

</body></html> - save this text as myform.htm, and embed it into your actual web page with the <iframe...> tag, followed by a hidden embed of the original iframe code provided by google, just to be sure:
<iframe src="[path]/myform.htm" class="iframe" width="270" height="145" frameborder="0" marginheight="0" marginwidth="0" style="overflow:hidden" scrolling="no" seamless="seamless">Form is loading...

<iframe src="https://docs.google.com/forms/d/1muQkd8tsycTHzhIn-WMYvws67GYqks6aEPdQuOJYvl4/viewform?embedded=true" width="1" height="1" frameborder="0" marginheight="0" marginwidth="0" style="overflow:hidden">Form loading...
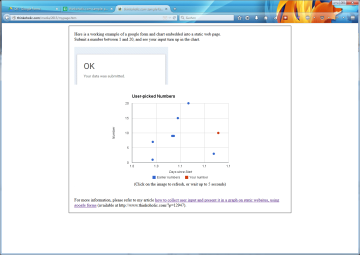
this will ensure that once somebody submits their data, they will remain on the page instead of getting forwarded to the google confirmation page. - speaking of the confirmation page: google's standard confirmation uses the form title and confirmation text. you can use this to your advantage by adjusting the form title to what you'd like the iframe box to say. for example, if you change the title to "OK" and the confirmation text to "Your data was submitted." your embed will look like this:
- one last issue with all this is that users need to manually refresh the page in order to see the updated graph with their latest submission, but i found a way around this as well: if you pass on arbitrary URL arguments after the actual image url, browsers will try to load a new image and ignore the fact that they might have the current version already in their cache, i.e.
https://docs.google.com/spreadsheets/d/1muQkd8tsycTHzhIn-WMYvws67GYqks6aEPdQuOJYvl4/embed/oimg?id=1muQkd8tsycTHzhIn-WMYvws67GYqks6aEPdQuOJYvl4&oid=2011707931&t=12345
and
https://docs.google.com/spreadsheets/d/1muQkd8tsycTHzhIn-WMYvws67GYqks6aEPdQuOJYvl4/embed/oimg?id=1muQkd8tsycTHzhIn-WMYvws67GYqks6aEPdQuOJYvl4&oid=2011707931&t=23456
will produce the same image, but circumvent local cache since the second URL is new to the browser. - first, make sure to give the image an appropriate id:
<img id="graph1" src="..." /> - then, using a little javascript magic, you can - for example - set your graph to refresh every five seconds, by passing a random number to variable "_t", which is ignored on google's side:
<script language="Javascript">

function reloadImage(sImgElementId) {

    var oImgElement = document.getElementById(sImgElementId);

	oImgElement.src = oImgElement.src.replace(/\&\_t\=.*/,"");

	oImgElement.src = oImgElement.src + '&_t=' + Math.random();

}

var timer=setInterval(function(){reloadImage('graph1')},5000);
or, if you'd rather do it manually, remove the last-but-one line ("var timer..."), and create a manual-refresh link around your image or some text:
<a href="javascript:reloadImage('graph1')" title="refresh graph">...</a>
as great as google spreadsheets are, their graphs unfortunately can’t display date-time values on the x-axis. One possible workaround is expressing time as “days since the start date” (which is why we need columns D, G and H), but you could also transform the timestamp to a comma-year format, e.g. 2015.0 for 1 january 2015 and 2015.5 for the half-year mark, 1 july 2015.
something that spreadsheets can do nicely, on the other hand, are array formulas: they’re formulas that are entered into the first data row, and automatically copied into new rows whenever more data is submitted.
so, we have our form and the data spreadsheet with columns for our graph's x and y values (columns D and E). let's create our graph.
for basic use, that's more or less it: you can link to your form, have people submit their data, and it will automatically show in the image you've embedded just above.
however, you can also integrate the form more seamlessly into your static web page.
to do so, ...
...and there you go. you've created a web form which displays the collected data graphically, using google forms and suitable for static html websites.
update on 2016-06-08:
fixed a bug in the javascript function which adds the random t-variable. the added second line of the function ("oImgElement.src = oImgElement.src.replace(/\&\_t\=.*/,"");") makes sure to remove the previous t variable from the image source. before, the image src received an additional "&t=" at every refresh, which meant that the src length increased while some browsers actually didn't reload the graph.
